HackOHI/O 2026: Building an AI Outage Concierge for AEP
One weekend at Ohio State, the AEP challenge, and a storm app that would rather say 'we don't know' than make up a number.
The weekend
From October 24 to 25, I was at HackOHI/O 2026, Ohio State's hackathon, with my teammates Gautham and Ornob. We picked the AEP (American Electric Power) challenge, and we spent the weekend building a project we called the AI Outage Concierge.
Our first commit landed Saturday morning at 10:56 AM. Thirty-one commits later, we had a working app on phone and desktop, a staff console, a backtested risk model, and a two-and-a-half-minute demo video with a voiceover split between the three of us.
The code is public at OSU-Hack-Club/2026-AEP-Challenge.
The challenge
AEP gave us a lot of real (anonymized) utility data: circuit maps, network topology, a few years of storm damage reports from their ARCOS system, pole records, and a spreadsheet of labor standards for how long each repair job takes.
The customer has none of that. When a big storm is coming, they want four things answered:
- Will I lose power?
- How long could it be out?
- What should I do to prepare?
- Will you tell me when something changes?
The brief asked for an app that answers those questions for one home, explains why, shows how sure it is, and handles privacy, safety, and the cases where the model shouldn't be trusted.
What we built
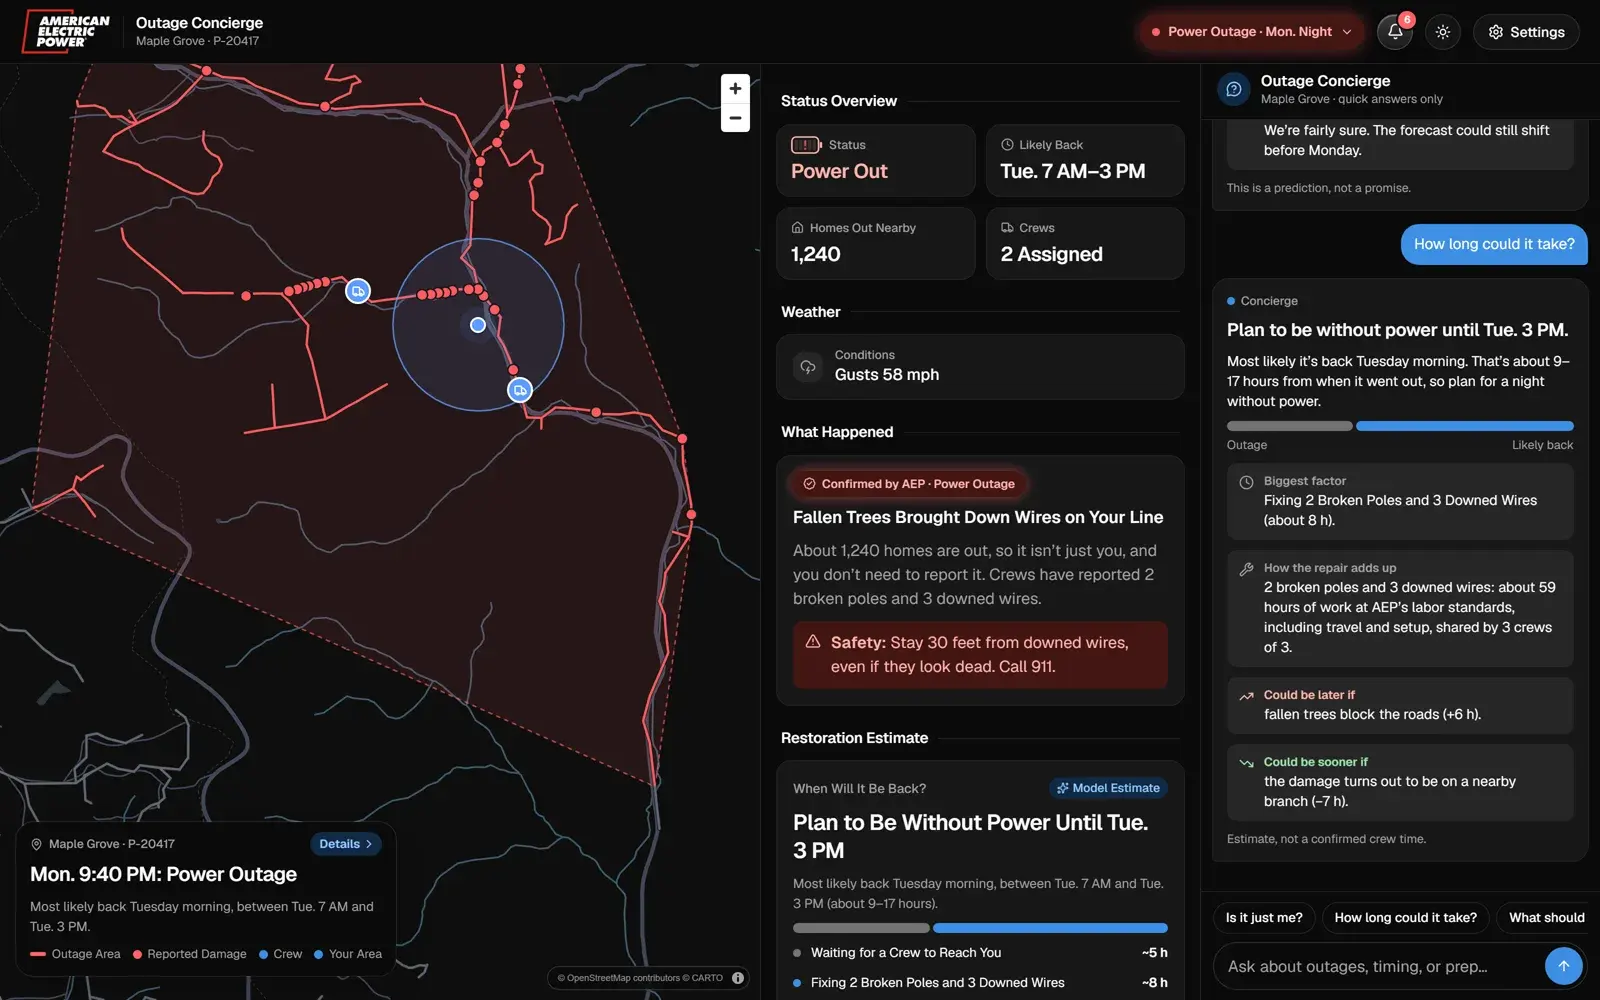
The AI Outage Concierge follows one customer through a whole storm in five stages: All Clear → Watch Alert → Power Outage → Restoring → Restored. The home screen, map, alerts inbox, and chat all change with each stage.
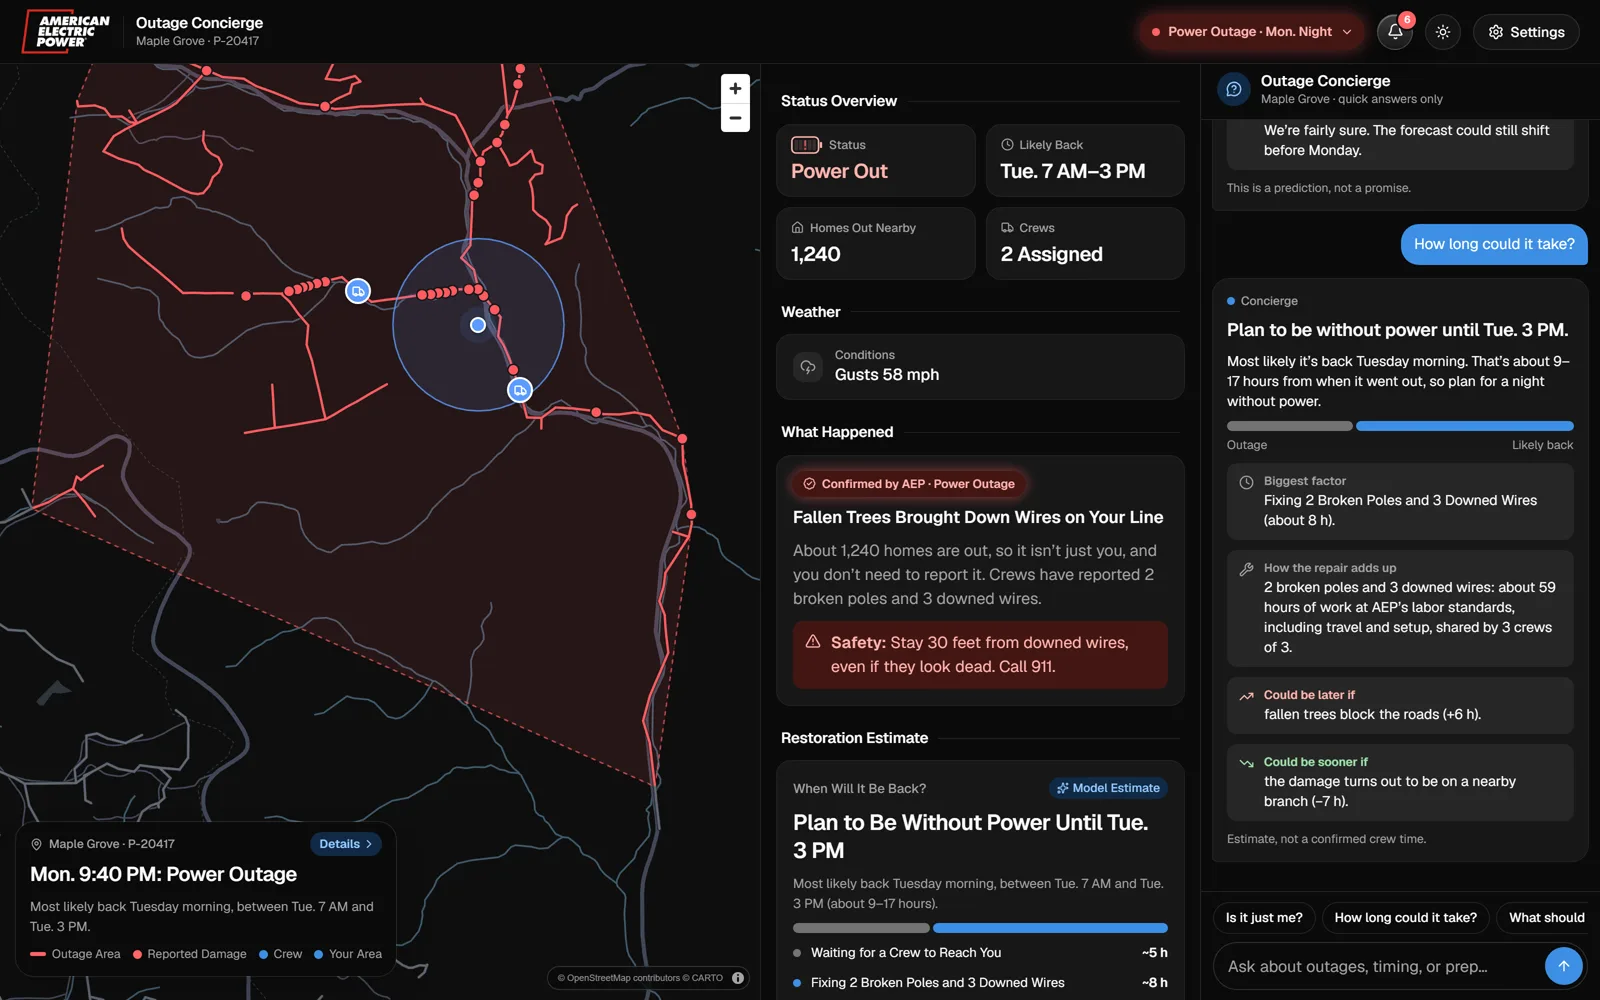
It's built on Next.js 16, React 19, TypeScript, Tailwind CSS 4, shadcn/ui, and MapLibre GL. The desktop and the mobile map-first layout share one state store, so you can flip between them mid-demo.
Outage risk, with reasons
You pick a home, and the app gives a five-level chance of losing power, from Minimal to Critical, plus a confidence score from 1 to 3.
The score comes from signals we pulled out of AEP's data: overhead vs. underground service, how many protective devices sit upstream of the home, how rural the area is, how long the feeder runs overhead, whether the circuit has a tie switch to another circuit, and how often that circuit (and the home's own power path) got hit in past storms.
That last one was the hardest part of the project. We grouped the ARCOS damage reports into 11 storm events, snapped each report onto the network, and figured out which fuse, recloser, or breaker it would have tripped. A home counts as "affected" only if that device sits on its own path to the substation. So the app can say things like "The line feeding you was damaged in 3 of the last 11 storms," and that's an actual traced number.
To sanity-check the model, we ran a backtest that hides one storm at a time and asks if the model would have predicted it. We got an AUC of about 0.60–0.63. A simple "overhead lines are risky" rule scored about 0.46. That isn't magic, and we tuned the weights while watching those numbers, so it's a sanity check, not proof. But it's honest, and it beats the obvious baseline.
Restoration time: a range, not a promise
Most outage tools give you one time ("back by 6 PM"), or just "assessing." We didn't want to promise a time we couldn't back up.
So the estimate is always a range, and it's built from the actual work. We wrote our own reader for AEP's labor spreadsheet (no packages) and turned each kind of damage into a bill of parts:
- a broken pole is about 5.3 person-hours (pole, crossarm, insulators, pins, grounding)
- a downed wire span is about 0.9
- a transformer is about 3.2
Every hour gets the workbook's 4.5× multiplier for travel and setup. Then crews get assigned to damage sites in parallel. Extra crews don't help if there's only one site, and the app tells you that.
The fun part is the Restoration Explorer. You can change the damage, the crews, and the road conditions, and watch the range move live.
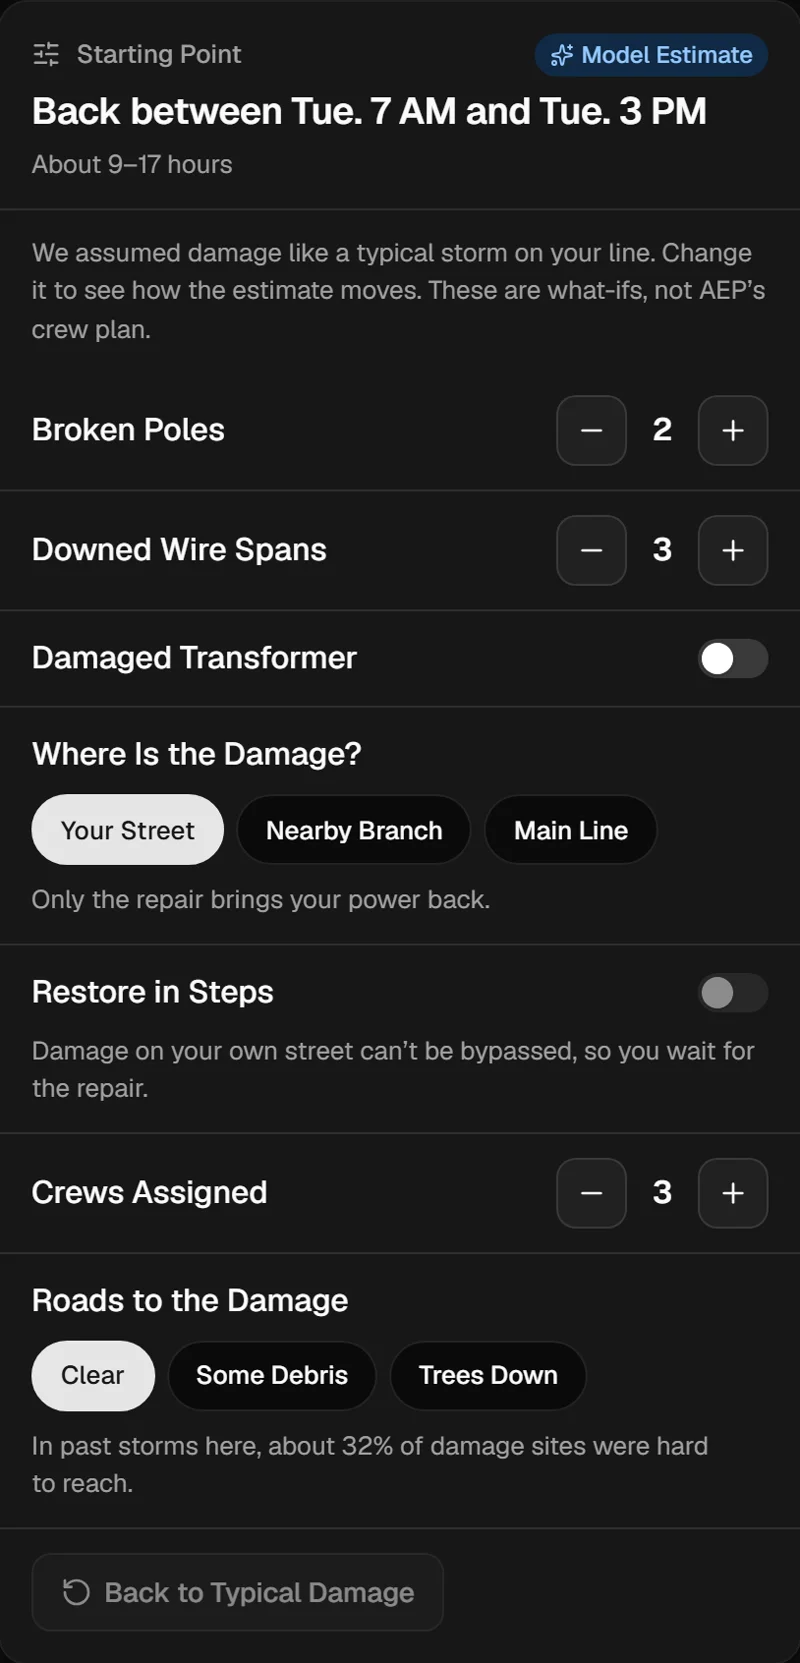
My favorite demo: switch Where Is the Damage? from Your Street to Nearby Branch, and the estimate drops from about 12.5 hours to about 5.6 hours. Crews can cut off the damaged branch and switch your home back on within about an hour, before the repair is even done. Main-line damage only gets that shortcut if the circuit has a tie switch, and damage on your own street never does.
Anything the customer changes is labeled What-If Estimate, never Confirmed by AEP. Keeping "what happened" apart from "what we think" was a rule we stuck to across the whole app.
Saying "we don't know"
This is the part I'm proudest of. If a home has fewer than three storms on record and missing inputs, or if 35% or more of its score rests on assumptions, the app doesn't show a number at all.
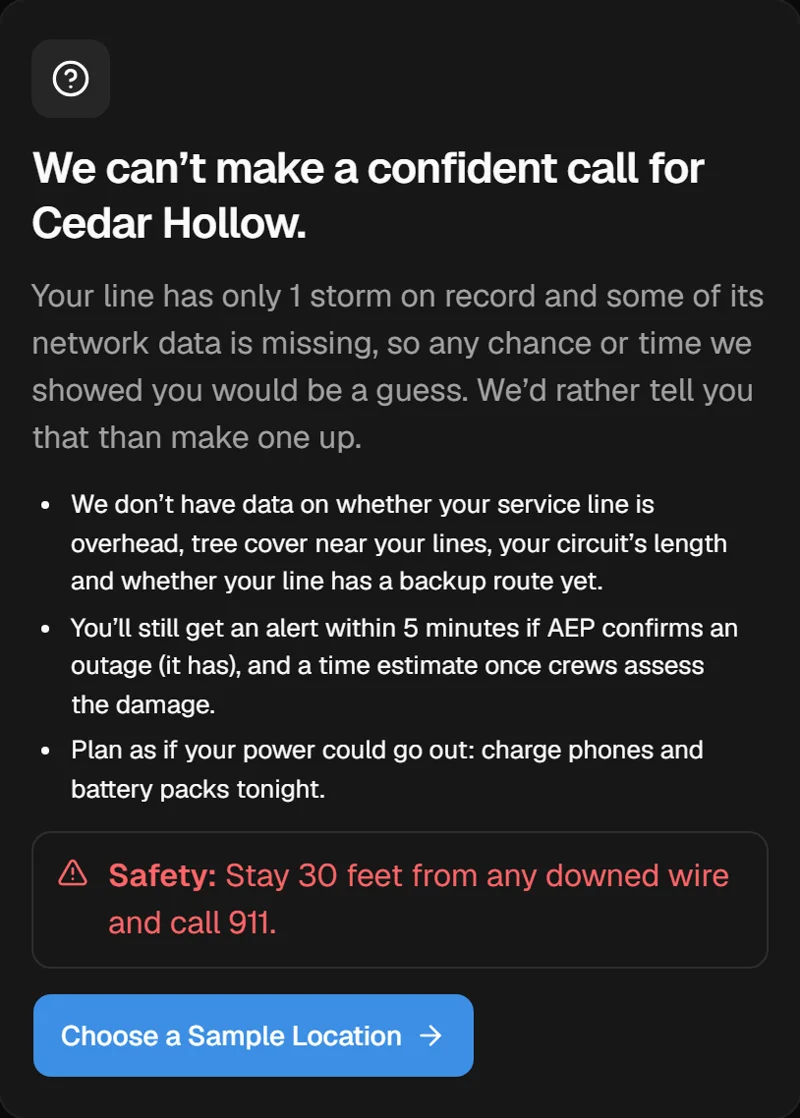
The alerts stay on, since we can't rule an outage out, and the case goes to staff for review. A made-up number would look better in a demo, but it would be worse for the person reading it.
Safety works the same way. Any question that mentions a downed wire, sparks, fire, or an injury never reaches the AI. It gets a fixed card: stay 30 feet away, call 911, and staff get flagged.
Preparation and alerts
Prep steps scale with how long the outage could last: charge your phones for a short one, think about food, water, and a place to stay for a long one.
Customers can also declare needs themselves: powered medical equipment, trouble leaving home quickly, deaf or hard of hearing, blind or low vision, or running a critical facility like a school or shelter. Each one changes the advice and the alerts. Medical-equipment users get warned 48 hours ahead instead of 24, plus a welfare check after 4 hours out. Deaf customers get texts instead of calls, and blind customers get calls. The app never guesses these from utility data, and they never show up on a map.
The AI part
The chat answers common questions with built-in, deterministic answers. Anything those don't cover can go to an LLM: Anthropic, OpenAI, or a local Ollama model. The AI only sees the current context and is told never to promise times. Before anything gets logged or sent to a model, phone numbers, emails, addresses, coordinates, and account numbers are redacted. If the AI isn't configured or can't answer reliably, you get a clear "contact AEP" card instead of a confident guess.
The app works fine with the AI turned off.
The staff side
The brief also asked for controls: confidence thresholds, human review, privacy filters, and an audit trail. We built those as a staff console.
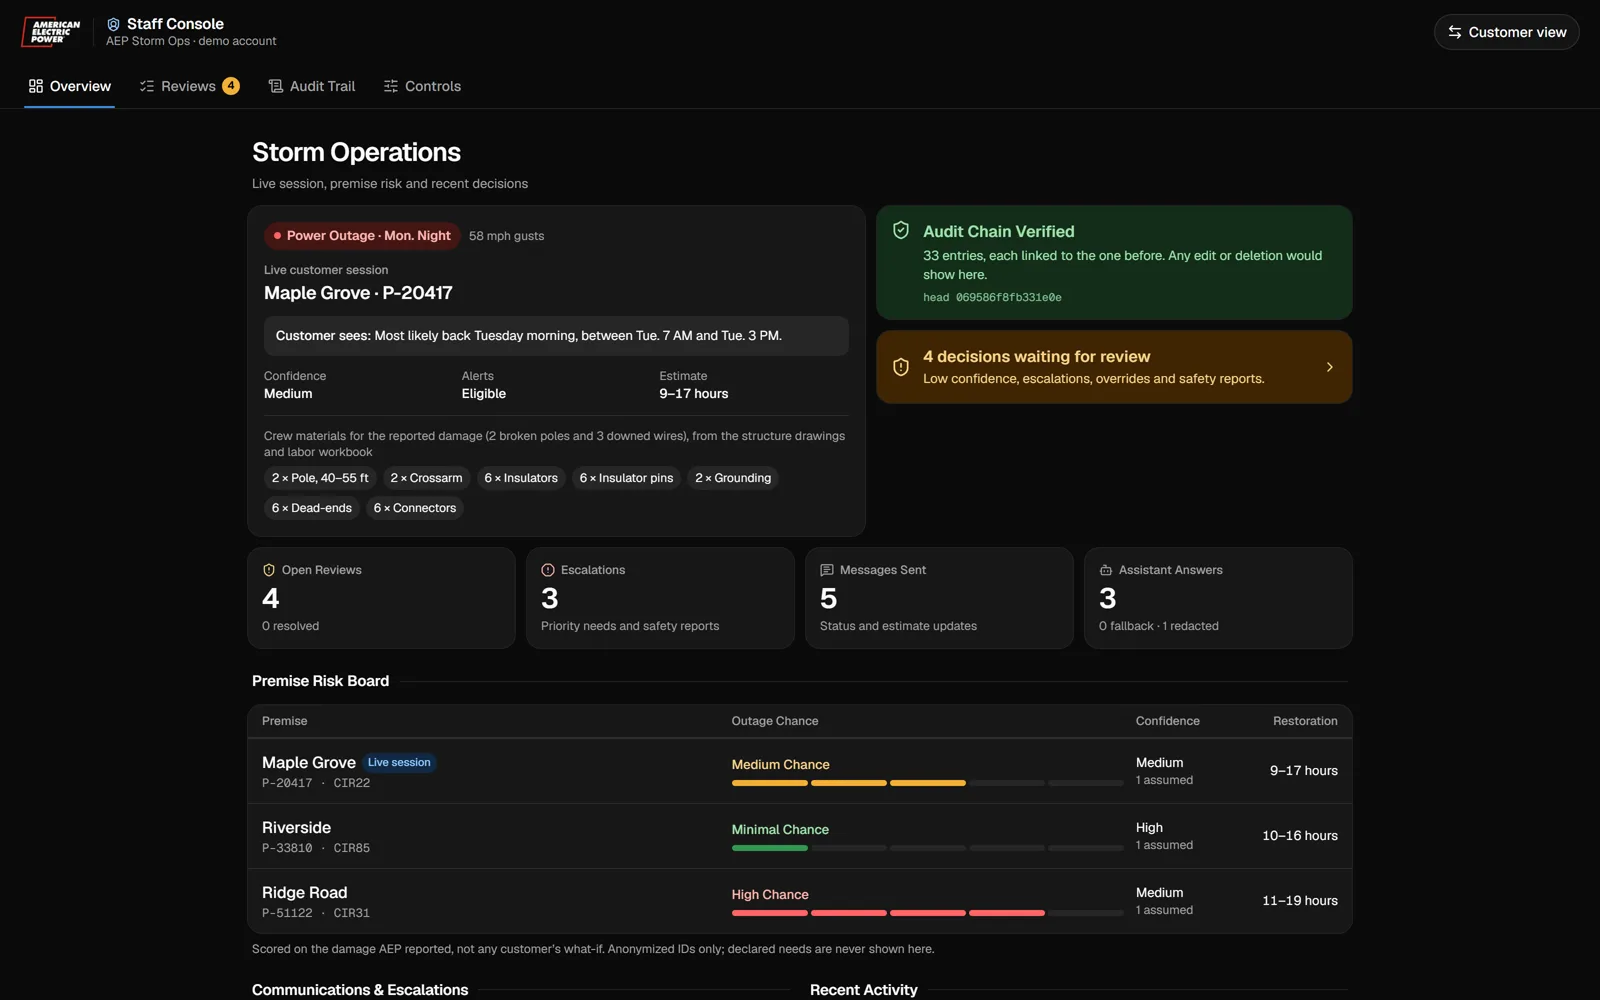
Every prediction, estimate, message, escalation, AI answer, and staff decision goes into an append-only log. Each entry stores the hash of the one before it, so editing or deleting anything breaks the chain, and the console shows it. (There's a "Tamper audit log" button in the debug menu just to show that off.) Low-confidence predictions, medical escalations, safety reports, and suspicious AI answers all land in a review queue where a person approves, overrides, or escalates them.
What didn't work
We changed course a lot over the weekend, and most of those changes made the app better:
- Our first restoration model was too simple. It cut repair time by a flat 40% whenever rerouting was possible, which gave about 7.6 hours. The labor-standard model gives about 12.5 hours for the same damage. That's longer, but now we can explain every hour of it.
- ARCOS dates couldn't tell us repair times. They're day-level only, and open repairs carry placeholder dates. So we used them only for how often sites were hard to reach (about 32%), and used the labor workbook for hours.
- Two signals ran backwards. Nearby damage and pole age sounded like great predictors. In the backtest, both made the model worse, because they mostly track dense, older city areas, which the biggest storm in the data hit less. We dropped them and wrote down why.
- We found privacy problems in our own app. Hospital and fire station markers were accurate to about a meter, so we snapped them to a roughly 1 km grid. Accessibility support only covered medical needs at first, so we added four more.
- The what-if controls felt like an operator tool. Stuffed inside the estimate card, they were confusing. Moving them into their own Restoration Explorer section, with the method explained on a Help page, made them much easier to use.
The demo video
For the submission, we made the video programmatically with Remotion. A Playwright script drove the real app through every storm stage in light and dark mode and captured screenshots, close-ups of cards, and a frame-by-frame scroll on mobile. Remotion turned those into clips: phones fanning in, the storm timeline, and the audit hash chain breaking when one block gets tampered with. Then the three of us recorded a voiceover, rotating speakers section by section.
It was a lot more work than a screen recording, but every clip came from the real app, and we could re-render everything whenever the UI changed. With a deadline coming, that mattered.
What I took away
The biggest lesson for me was that honesty is a feature you have to design. It's easy to build a dashboard that shows a confident number. It's much harder to build one that shows a range, says what it's unsure about, keeps the utility's facts apart from the model's guesses, and refuses to answer when the data is too thin. Almost every pivot above came from asking, "Is this number actually true?"
Huge thanks to Gautham and Ornob, to AEP for a challenge with real data behind it, and to everyone who ran HackOHI/O 2026.
If you want to dig into the model or run it yourself, it's all on GitHub. It runs locally with npm ci && npm run dev, no API keys needed.